Car Dealer Profit
The charts below show the number of cars John sold last year and the profit he made per car.
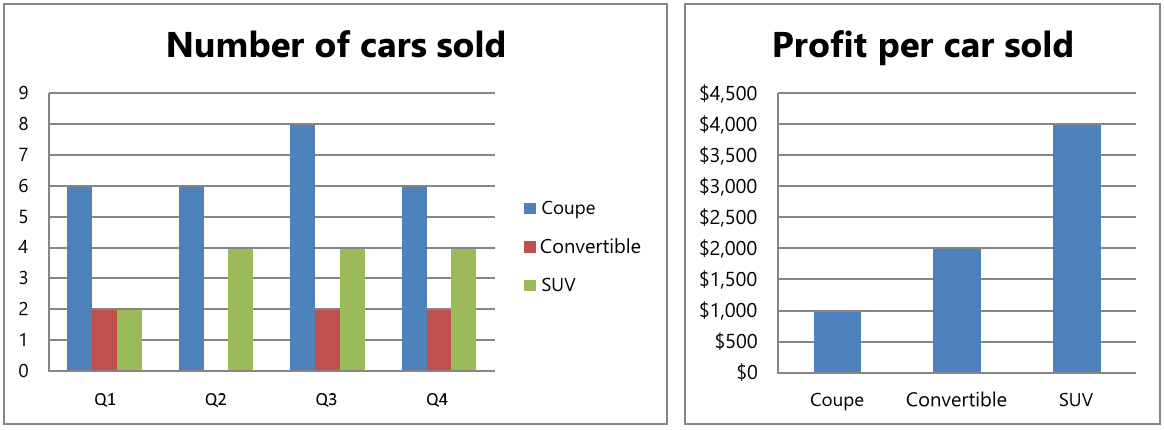
Considering all car types, in which quarter did John make the largest average profit per car?
Tags
- AI-resistant
- Numerical Reasoning
- Chart Lookup
- Public
- Hard
Information
Difficulty: Hard
Duration: 5 min
Score Distribution
% of candidates
Score
Would you like to see our other questions?
We have 1000+ premium hand-crafted questions for 160+ job skills and 20+ coding languages. We prefer questions with small samples of actual work over academic problems or brain teasers.
Would you like to see our tests?
The following tests contain Numerical Reasoning related questions:


On the blog
Since we're all biased and we use incorrect proxies, why not just outsource hiring to experts or recruitment agencies? After all, they've been screening people for many years, so they must know how to do it right?
Not really. I was surprised to discover that many experts...